Defining your analytics
Web analytics are defined as the measurement, selection, analysis and reporting of internet data for the purpose of understanding and optimising web usage.
In a nutshell: your analytics show you trends on how people are engaging, or not engaging with your site. You’ll see areas requiring investigation for potential optimisation. That could mean altering the information architecture (IA), changing the user interface (UI), clarifying the copy, or carrying out a technical fix. Anything to help people do what they’re trying to do, faster and easier.
The analytics you select, measure and analyse should be informed by your customers’ needs and your business’s goals.

Ask the right questions to get the right metrics
Without context to shape them, analytics are basically a massive dump of data. You need clear, measurable goals to get the most out of them. These may depend on your company size, whether you want to monitor your entire site or just a particular page.
To get an idea of what you want to track, ask yourself three questions:
- What are your main business goals?
- What are people trying to do?
- What do you want people to do?
Your overall business goal can be supported by a series of stepping stone-like micro-goals. For example, if your main goal is for people to buy insurance, then a micro-goal might be first seeking a quote. Focussing on your micro-goals is a good way to choose metrics that are narrow and specific. This is especially helpful to see what parts of a user flow are underperforming.
A metric for every measurement
When it comes to the metrics you can track, you really are spoilt for choice. It pays to be picky, though. Those you choose to track should be informed by the overall context of UX design, and your user and business goals. However, there are some basic metrics you should take a closer look at to see where improvements could be made:
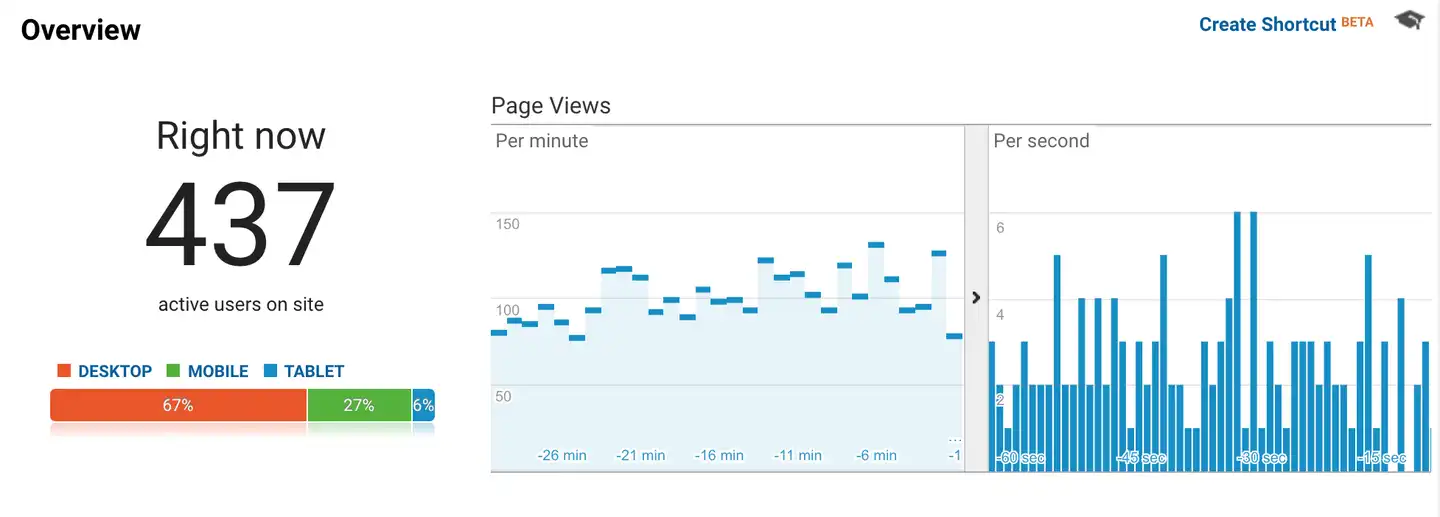
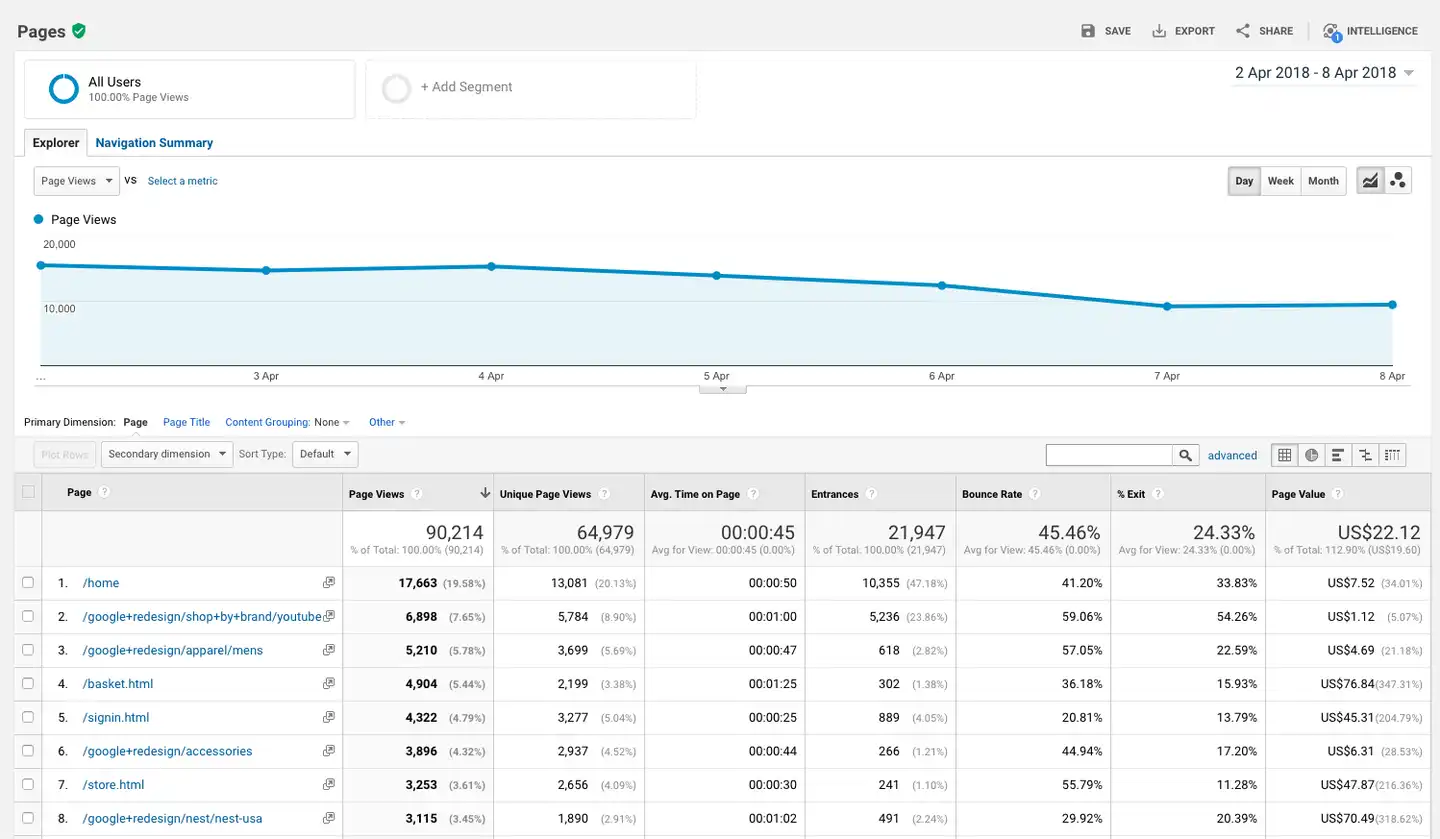
- Pageviews – How many times a page is viewed.
- Unique events – When someone interacts with content on a web page, such as clicking on a ‘download’ button.
- Session duration – The average length of time a users spends on your site.
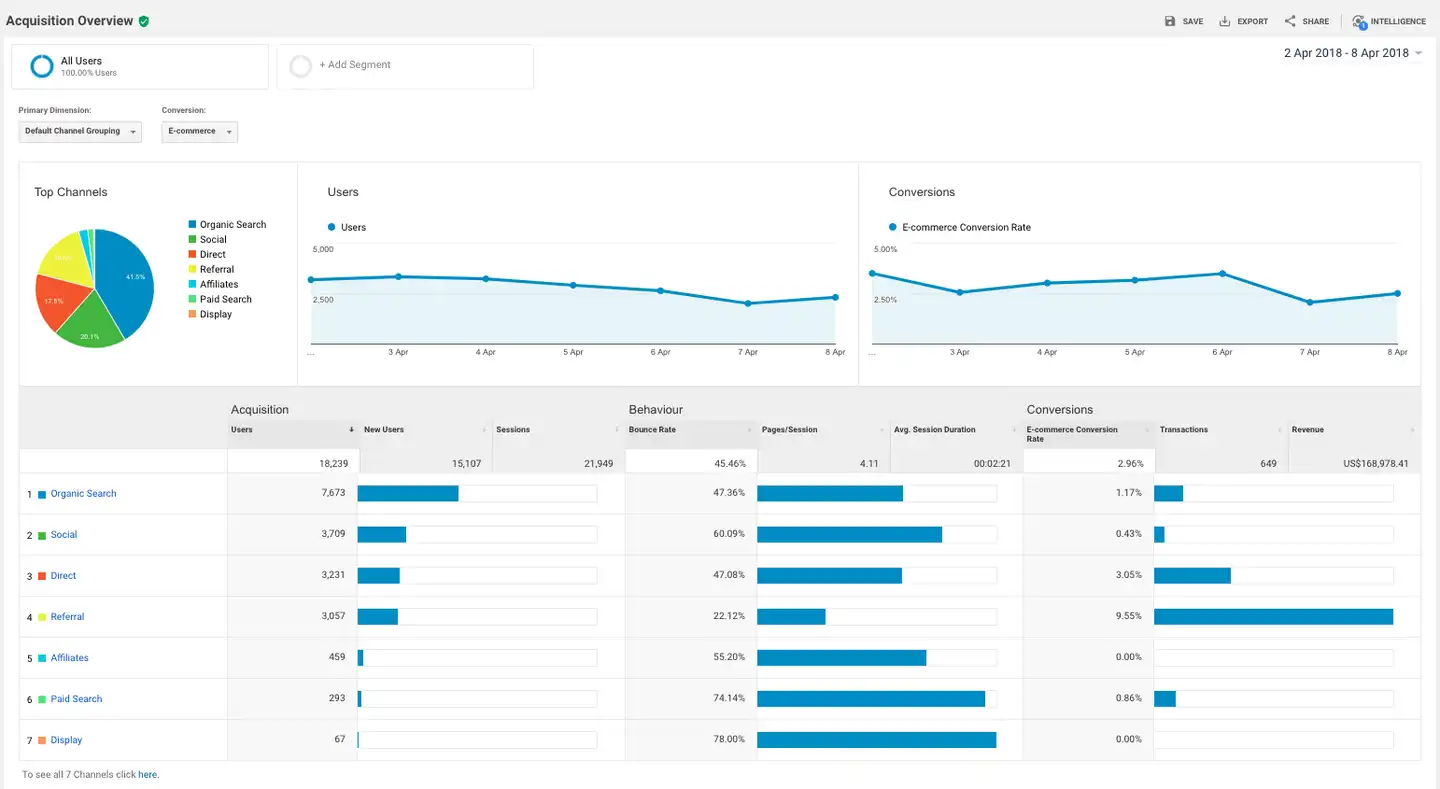
- Bounce rate – When someone opens a single page on your site, then leaves without opening another page. The bounce rate is a measure of bounces as a proportion of total sessions on your site.
- Entrance – Where people are entering your site from. If you’re running a campaign, looking at landing pages helps you understand how well it’s going.
- Goal conversion – Goals are what your website is setting out to achieve for your business. For example, a goal for an ecommerce site is a someone making a purchase. A conversion is made every time that goal is fulfilled. Measuring goal conversion tells you if your website is helping you reach your business goals.
Whatever you do, don’t settle for metrics that only give insight into your vanity.

Tools for the trade
When you hear the word analytics, it’s inevitable Google Analytics will come to mind. Fair enough. It’s perhaps the most accessible analytics package out there and it’s easy to integrate into your site. And no, this isn’t a promo piece – there are plenty of alternatives – it just happens to be really good at what it does.
Opportunities for optimisation
Reviewing your website’s analytics can show you where users may be tripping up on confusing, missing or underperforming content. Red flags to look out for:
- Pages (or steps in a flow) that have significant drop off rates.
- High or zero per cent bounce rates.
- Users spending a long time on one page.
- High volume of search queries for a particular term.
- Low goal conversion rates.
Analytics show you something’s going wrong on a particular page, but can’t tell you exactly what the problem is. Or, how to fix it. Thankfully, there are tools and techniques to help you do that.

Focus on your feedback
To find out where your users are having difficulties, carry out your standard UX practices and gather some real-world user feedback.
- Feedback survey – Ask people to give quick feedback – no more than one or two questions – on what they set out to do, whether they succeeded, and if not, why not.
- User testing – Watch how people move through a page and make note of where they’re having trouble. Get them to talk about their expectations as they browse menus, click links or fill in forms. It can unearth issues that may not have occurred to you.
- Heat-mapping – Seeing what your users are clicking on tells you what they’re coming to your site to do. Based on their clicks, you can make UI and content changes to prioritise their needs.
- A/B testing – Test the effect of changing the UI or IA on two different versions of a live page. This lets you compare whether a change is helping, or hindering, your users.
Heuristic walkthrough
A heuristic walkthrough involves checking whether the key user flows follow established UI rules-of-thumb. Evaluate these four heuristics before carrying out your analytics review:
- Friction – Is the user being prevented from completing what they need to?
- Clarity – Does the copy make sense? And if the user doesn’t understand, is there supporting help text?
- Distraction – Are there ads or links which are taking users off the page?
- Anxiety – Does the copy make users feel uneasy?
Approaching the page from a user’s perspective is a quick, cost-effective method of uncovering both major and minor usability issues. The major benefit to these approaches? You get direct and observable user feedback. You can apply what you learn to making recommendations for what needs to be changed. By making the user’s experience quicker and easier, the more positively they’ll view your site and your business.
Big data, deep insight
There really is no one true approach when it comes to analytics. If you’re seeking insight that is relevant and useful, do you and your customers a favour and measure only the metrics that truly matter. To them. And to you.
Don't know your bounce rate from your unique event? Get in touch for a friendly chat about how we can help you make sense of your analytics.
Analytics examples sourced from the Google Analytics demo account.
Get in touch
Let’s make the things that matter, better.
Email: hello@springload.co.nz
Phone: +64 4 801 8205